At last I reached the integral part of Calculus. I was eager to get there since it dealt with a topic which I find fascinating, how can I find the area of a curved object.
You see, area for me,and for the rest of the world, is width x height. Which is pretty simple if you are dealing with rectangles. However, what happens when you are not dealing with straight lines and need the area of a curved region. Well, apparently you just part from what you know and build a bridge!
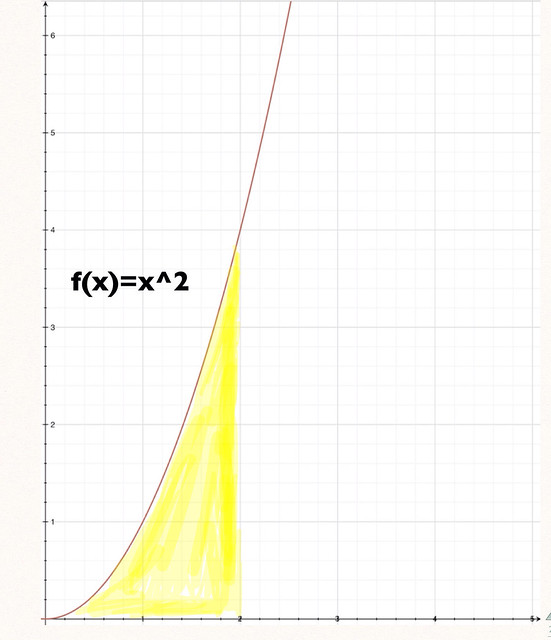
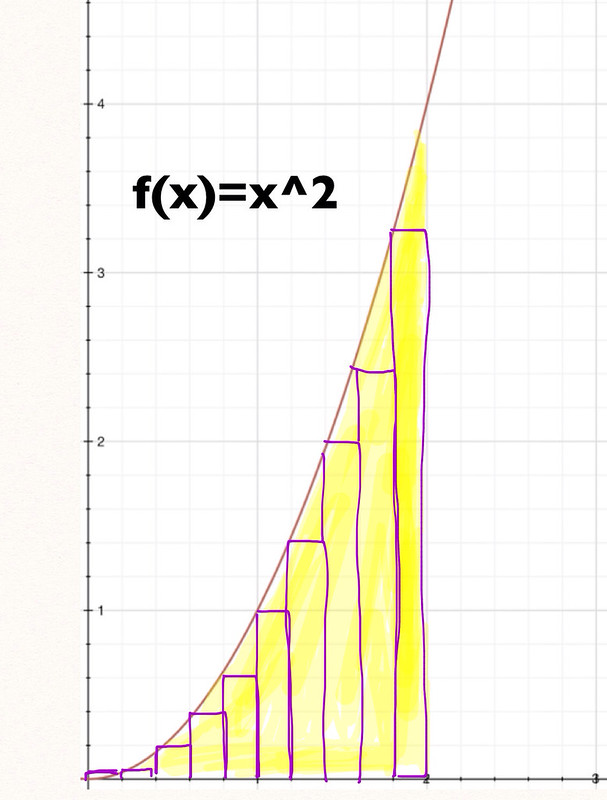
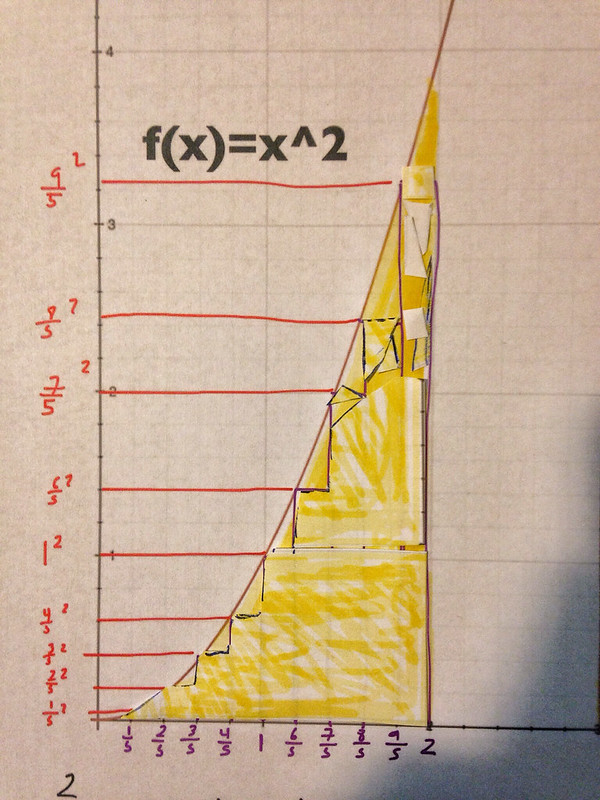
What I mean by that is that if I wanted to find the area under a curve like the one in the picture opposite. I can draw rectangles under the curved region up to the function and approximate it's area by summing the areas of all the rectangles I drew. That is a neat trick that has served humanity for centuries. And the cool part is that if I can make the rectangles thin enough, I can get a better approximation of the area I am looking for.
If the concept of getting better approximations by making an interval smaller and smaller a sounds familiar it's because we saw it back in limits and derivatives.
So how do I go about summing all these rectangles? I mean of they are 5 or 10 it's simple enough to do it by hand, but what is they are 100 or a 1000...or n rectangles!
That is were sigma comes in.
Have you met sigma? That weird looking capital E that might hunt your math nightmares. It turns out it is tame enough once you get to know it.
Sigma is just notation for adding something over and over again. I loved it when Professor Fowler at Mooculus compared it to using a "loop" in programming. It basically encodes and bounds a sum for a specified interval. One of the things I remembered having problems with was the notation used in sigma. For some reason back in college I found it difficult and unapproachable. Now it looks quite simple.
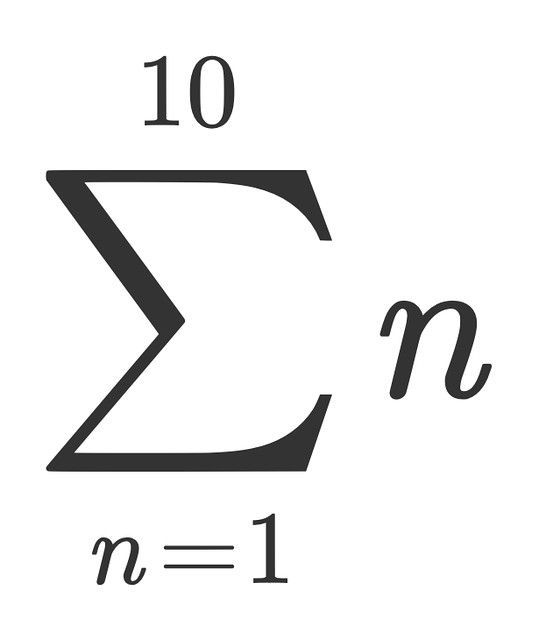
Let's imagine I want to add 1+2+3+4+5+6+7+8+9+10. If I have to write that sum over and over again it gets kinda tiresome. So I will use sigma as shorthand for that sum. But first, let's think about what I am summing: the number (whole numbers; integers; in order) form 1 to 10. So if I had a machine that would spit out a one then a plus sign then the next number after one and so on, I would replicate that string of numbers above. Well that is what sigma does, let's see:
Whenever you see that weird E, just imagine it is saying "please add the result of whatever formula is after me, starting with the number that is under me in the variable and repeating the process as many times as the number above me while making n to be a whole number greater after every repetition." Well, at least it said please.
Okay, first we have that n is the formula we are summing. Then under Sigma is an n=1, meaning the first result is 1. The it is asking us to repeat the process 10 times, that is the number over sigma. However, after each repetition we must make n a number greater than before.
So we start with n=1, then add n=2, then add n=3 and so on until we add n=10, 1+2+3+4+5+6+7+8+9+10! For a better (much better) explanation you can go here.
So if I take the example above, and lets say I divide the area under the curve into 10 sections of 1/5 square units, whose height is the formula f(x)=x2 evaluated at those cut points.
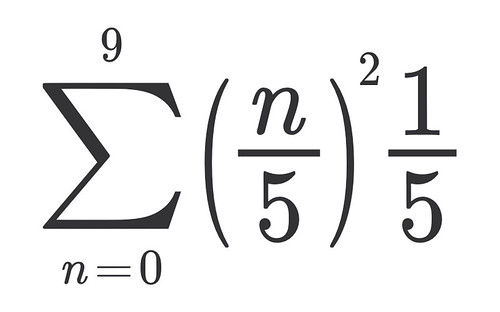
Therefore, the first rectangle would have area 02 times1/5=0, the next would have area (1/5)2 times 1/5=.008, the one after would be (2/5)2 times 1/5=.032 and so on. We could represent that sum this way, at least I think we could:
I Sigmalize we are saying square the 5th of whatever n is from 0 to 9 (the height of our rectangles), then multiply it by 1/5 ( their width) and Sum all 10 results.
This will give you an answer that the area under the curve is approximately 2.28 square units.
That is not bad as approximations go. If you see the two pictures bellow, I shaded the 2.28 square units and pasted them to cover my rectangles.
But as you can see, I could not cover all the area under the curve. There are some triangles that go from the base of the rectangles up to the curve that I cold not cover. To cover all the area under the curve I would need to make smaller and smaller rectangles. In fact if I could make those rectangles infinetly small, I could approximate almos exactly the area under the curve.
I'll give you a preview. The area under the curve is actually closer to 2.666, but we will need to use something I have been looking forward to learning for a long time: Integrals.
Let me know if I got this right in the comments.


thank you for existing
ReplyDeleteGreat and that i have a tremendous provide: Who Repairs House Foundations house renovation cost
ReplyDelete